
13
Adding more tests from students with the same abilities to the VES Engine (Table 18) did not change the average student score, standard deviation (SD), test reliability
(KR20 or Pearson r), standard error of measurement (SEM) or average item discrimination (PBR). It does change the stability of the data. A rule of thumb is that data
become reasonably stable when the count reaches 300.
Above 300 the count becomes representative of what can be expected if all possible students were tested. But no student or class wants to be representative. All want to be above average. All want their best luck on test day when using traditional multiple-choice (TMC).
Above 300 the count becomes representative of what can be expected if all possible students were tested. But no student or class wants to be representative. All want to be above average. All want their best luck on test day when using traditional multiple-choice (TMC).
Although individual students do not benefit from testing
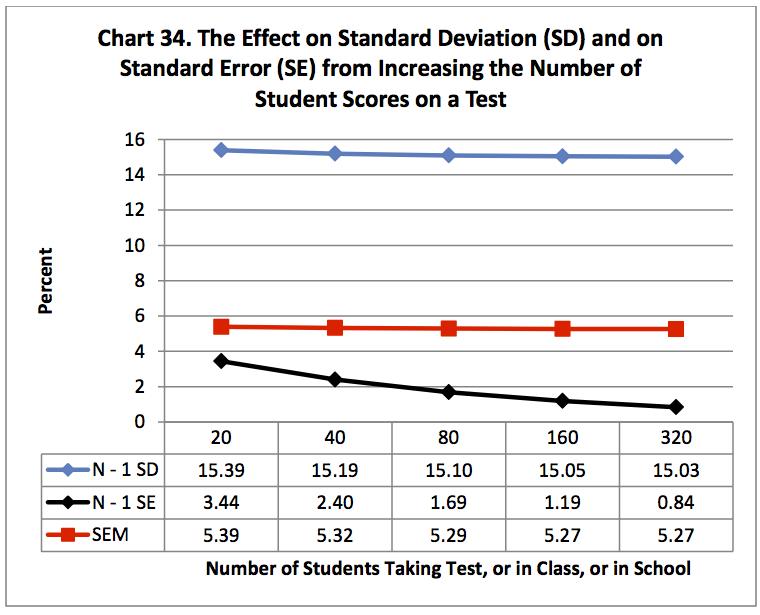
increasing numbers; teachers, schools, and test makers do. The SD divided by
the square root of the number of tests yields the standard error of the test
score mean (SE).
Chart 34 shows a slight curve for SD and SEM. This comes
from dividing by N – 1 rather than N. The effect disappears above a count over
100. The SE is smaller than the SD and SEM and shows a marked change for the
better as more tests are counted. It easily permits finding differences between
groups of students when you use test enough students.
The SD, SEM and the SE have the same predictive distributions.
About 2/3 of student scores are expected to fall within plus/minus one SD (15.39%
for a test of 20 students) of the mean. If a student could repeat the test,
with no learning from previous tests, 2/3 of the repeats would be expected to
fall within plus/minus one SEM (5.39% for a test of 20 students) of the mean.
These values (expected 2/3 of the time) cover too wide a range (30.78% and
10.78%) to permit separating individual student performance from year to year.
The SE is different. Starting with 20 students; SEM and SE
are fairly close. But with 320 students the SE (0.84%) is five times more
sensitive than the SEM (5.27%) in its ability to detect differences between
groups than the SEM in its ability to detect differences in student ability.
These values are all from perfect world data (Table 18) where all
students earn the same low score or high score. Item discrimination is set at
the maximum. The test is performing at its best (average student score and item difficulty of 50%, test reliability at 0.877, and average item discrimination at 0.30). With
only 20 items, these data indicate to me that individual student performance
cannot be divided into different groupings by a perfect world SEM and therefore
cannot be divided with actual classroom data either.
These data also put into question if the SE can separate
group performance for individual classes, individual teachers and individual
schools. The counts are just too small. Teachers with large classes, or with
several sections, have an advantage over those with a small class.
Adding more students to a test is of little benefit to
individual students. It is of benefit to teachers , schools, and test makers.
For students we need more test items and IMHO a test scored for what students
trust they actually know and can do such as Power
UP Plus by Nine-Patch Multiple-Choice, partial-credit
Rasch model by Winsteps and Amplifire
by Knowledge Factor.
- - - - - - - - - - - - - - - - - - - -
-
Free software to help you and your students
experience and understand how to break out of traditional-multiple choice (TMC)
and into Knowledge and Judgment Scoring (KJS) (tricycle to bicycle):
No comments:
Post a Comment